
A blog post by Fatih Ozturk, Matt Carstens & Anil Celik
A couple of years ago when UrbanStat first started operating, our solutions focused on simulations, deterministic/probabilistic risk analysis, and data visualization. Leveraging a large list of external cat/non-cat data sets and having access to historical datasets from multiple insurance companies enabled us to focus more on machine learning based predictive analytics and create even more value for our carrier partners.
Our focus was on finding a way to accurately predict high-risk clients, at the time of underwriting, based on their likelihood of claims and damages within a year. Defining “high-risk” is very much dependent on the insurer’s risk appetite as the events we are trying to predict are quite rare and can materially affect the underwriters’ performance. This makes this problem both challenging and exciting as we’ve returned clear risk selection improvements with our partners.
The graph below visually communicates our goal and value-add in the risk selection process
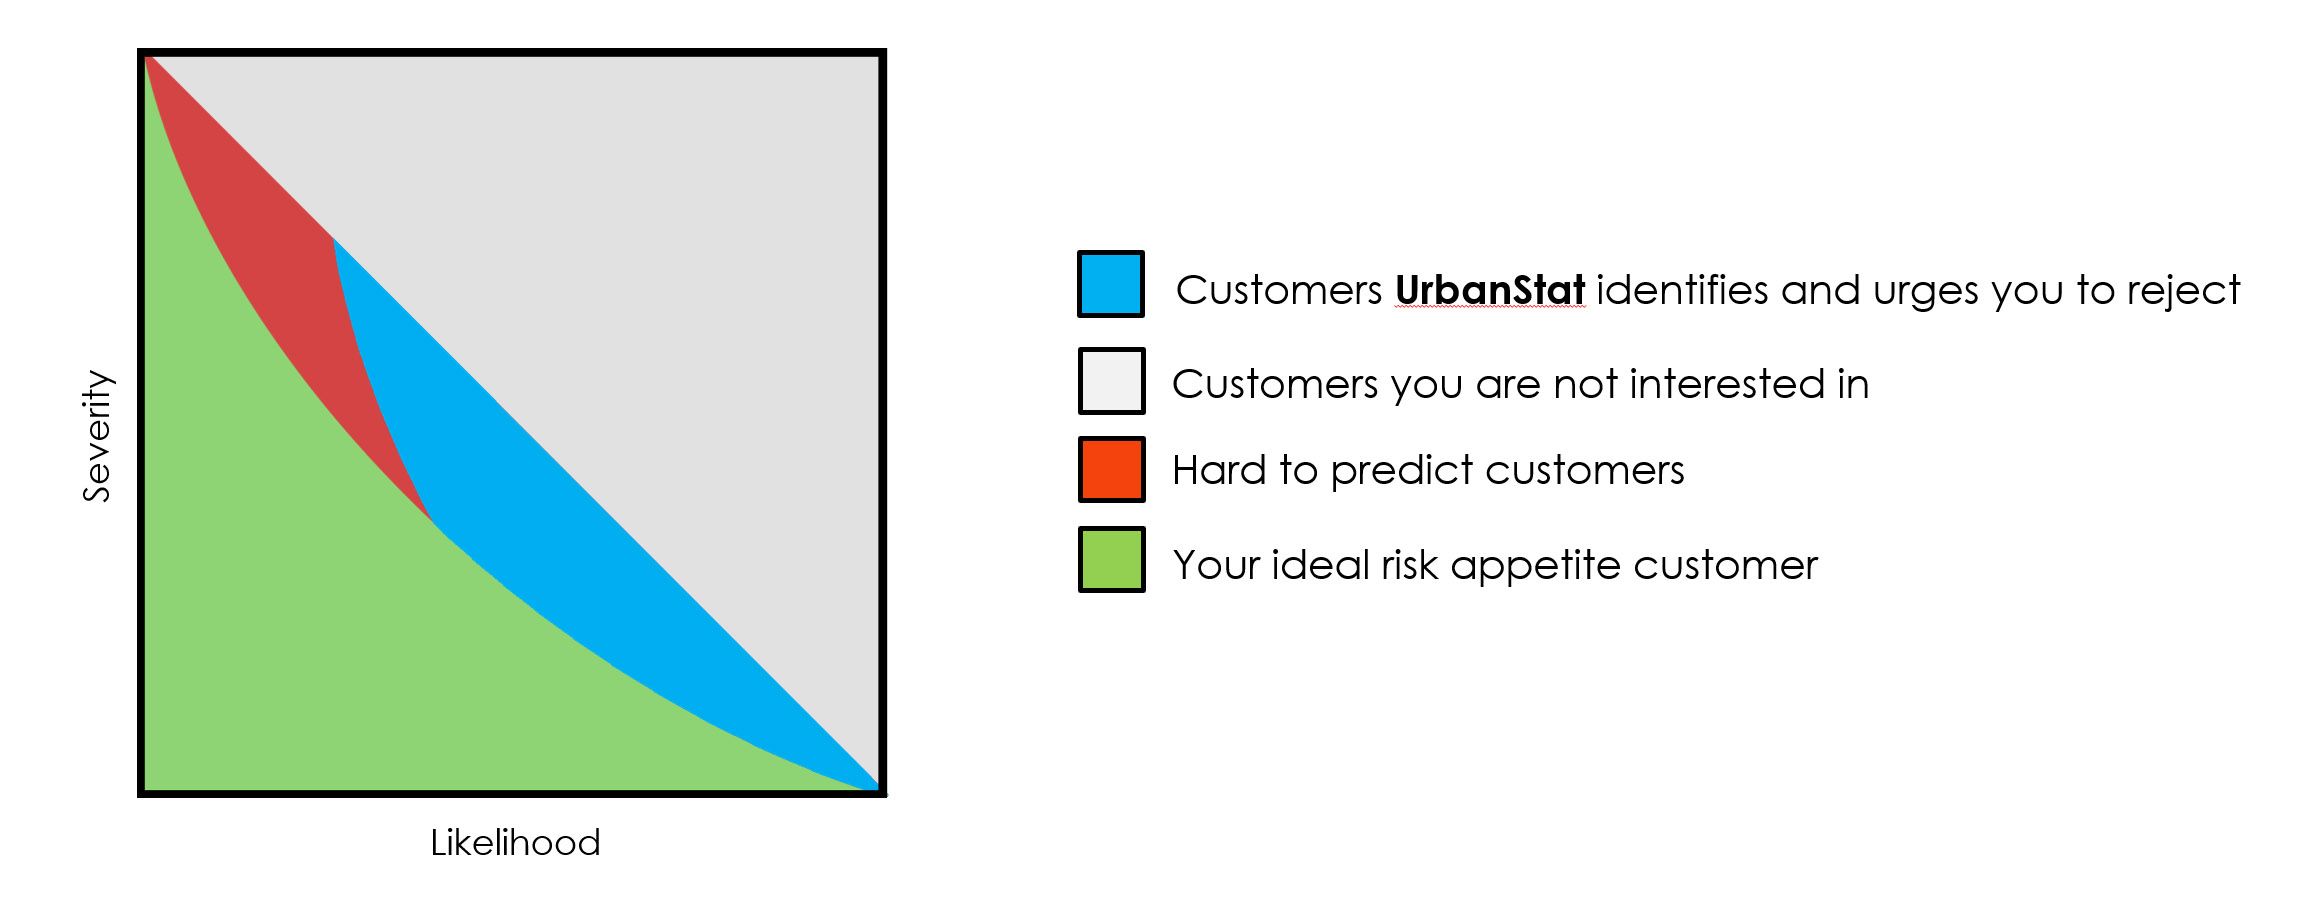
All insurance carriers have this hypothetical curve (green zone) that represents the ideal clients they want to win. They are OK with paying claims, as long as they are in the green zone (risk appetite). However, carriers end up with this triangle instead (green + blue + red) due to common risk identifying complexities and the lack of proper tools (technology, skillset, team, process etc.) for this problem. Although it’s possible to identify many of the clients that are in the blue zone, It’s almost impossible to identify the ones in the red zone (or as we call internally the god-zone).
Every client is different so are their risks
We believe one of the most obvious reasons for missing “right” clients or winning “wrong” clients in the selection process is that carriers are still not granular enough in their segmentation. The problem with this type of segmentation is that many times clients are considered to be similar (if not identical) to everyone else in, let’s say, a given neighborhood so we need to come up with new approaches to enable personalized underwriting.
Automating a personalized risk selection process for an underwriting team is something we continue to refine and work with our carrier partners on. We continue to focus on identifying high-risk clients that are in the blue section in the graph above so insurance carriers can identify, reconsider or reject clients that pose a greater risk threshold than their internal mandates – as this small percentage of clients are actually threatening the wellness of the portfolio as a whole.
How to choose policies to be rejected?
At first glance, one may think it’s an easy question. You should reject policies that are more likely to have higher (how high is defined by the risk appetite) damages than their premiums, which are causing losses to companies. However, when this issue comes to ML, it’s not that easy.
Let’s assume there is an insurance company X and its main goal of ML usage is maximizing its profit. Theoretically, maximized profit can be reached only by eliminating all policies having higher damages than premiums. So, labeling such policies as class 1 and the rest as class 0 can be a good start for ML. However, since there is a huge class imbalance in this industry (more information) and challenging nature of claim prediction, it can be difficult to have satisfying prediction accuracies. Moreover, false predictions can cause more loss than the profit increase caused by true predictions.
So, carrier X needs to consider other objectives in which machine learning algorithms will be able to provide ‘optimal’ profit for them. Here are a few objectives decision-makers need to consider:
- Loss ratio
- Actual profit
- Revenues
- Losses
- Market share
It is quite possible to have great results on loss ratio while losing actual profits, revenues, and market share, or if you just focus on market share, you could actually increase your loss ratio and reduce your actual profits.
At UrbanStat, our objective is to maintain or improve actual profits while reducing the loss ratios with minimal effects on market share. This means by rejecting ~ 3% of your targeted high-risk submissions (minimum loss of market share) you gain an opportunity to improve your profit and your loss ratios at the same time. This approach will enable you to grow in the right direction with increased profits immediately and eventually improve your other financial results and provide better prices and terms to your own clients.
Approaches are not objectives
Although your objective stays the same, your approaches can vary. In our case, the most common approach would be regression and classification.
You can try to predict damage, profit, loss ratio, or a combination of these metrics using regression. After obtaining such predictions, you can easily come up with strategies based on your clients’ “profitability”.
Another approach would be classifying (identifying) clients whether they belong to a certain group of clients –again by analyzing their damages, profits, loss ratios, number of claims, or a combination of these features. This approach may sound like existing rule-based segmentation algorithms, however, it’s drastically different in terms of its development.
Depending on the carrier’s historical data, the performance of these different approaches is varying. Our experience shows that classification algorithms work better for many insurance carriers, although one should test both approaches to determine what works better for them.
So what UrbanStat’s doing differently?
On average, an insurance carrier provides to us around 100 columns from their clients. We increase the number of columns (features) to somewhere between 600-2000. Gathering and creating external datasets that would explain the damages (e.g. flood hazard maps, hurricane maps, terrorism database etc.) is the first step. We combine this information with carrier’s historic losses. Half of our time is usually spent on engineering additional features than what the carrier provided, where those new features really empower the machine learning applications for success. From our experience, we found that on average 74 of the top 100 features used for prediction are features that we have engineered ourselves. Removing those features makes the models unprofitable immediately.
Results
After learning and working on historic datasets of more than 10 insurance carriers, we can confidently say loss ratio improvements of 17% is achievable which some results actually even much higher.
To learn more and quickly leverage what we’ve already successfully deployed for our carrier partners contact us at [email protected].