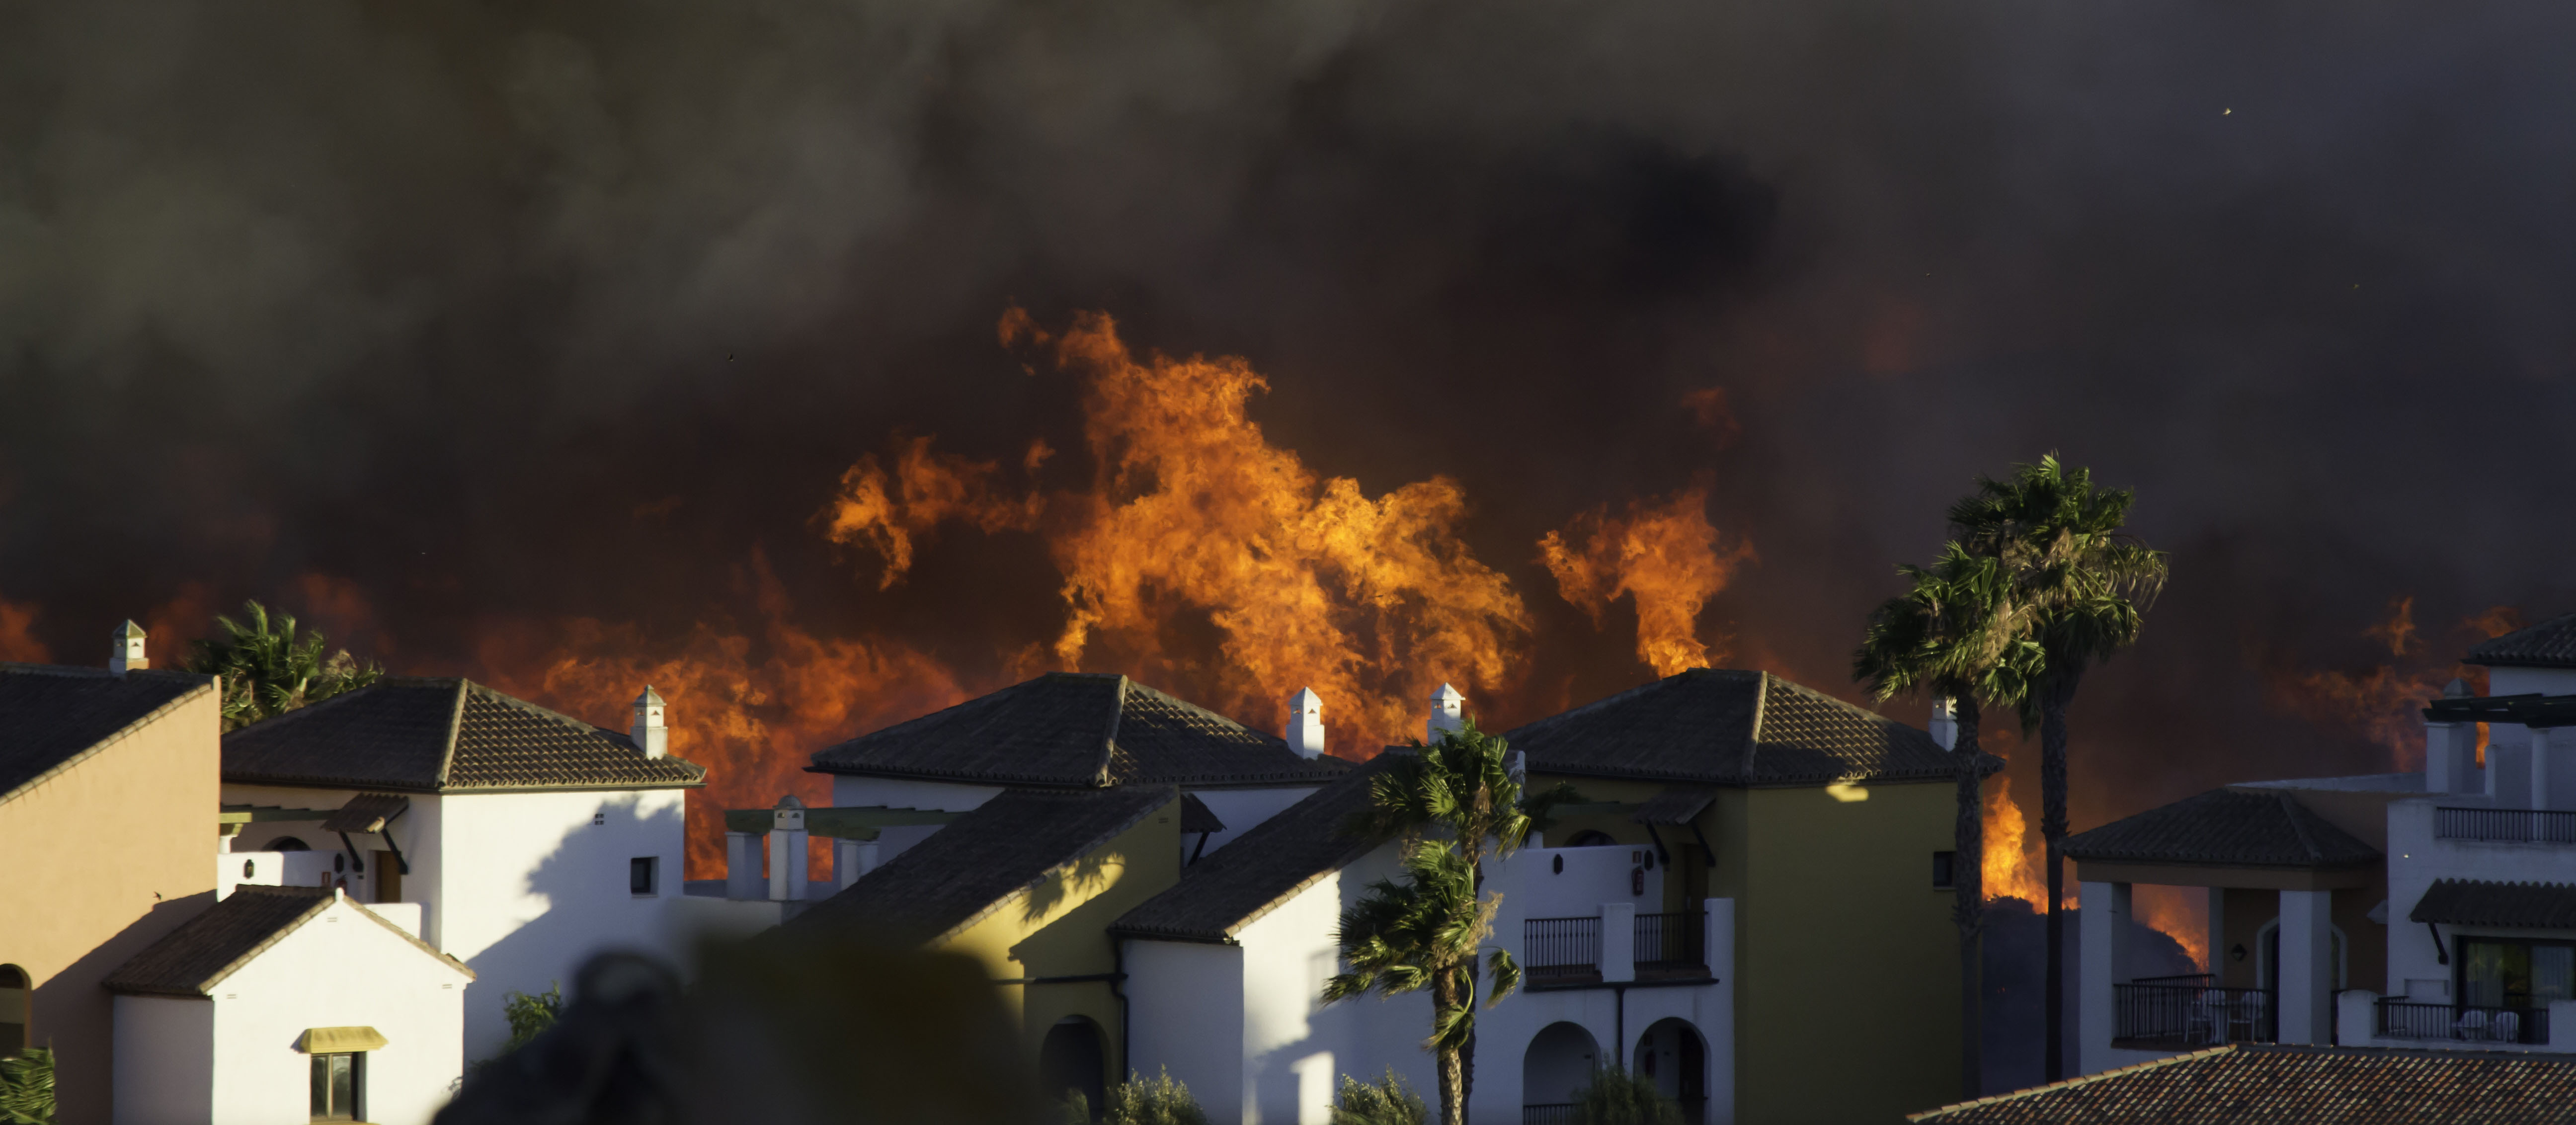
A blog post by Anil Celik
California has been experiencing its worst years with wildfires. Of the 10 largest wildfires, 9 occurred after 2000, and 5 occurred after 2010. The Camp Fire (2018) was the deadliest (86 civilians) and most destructive (~20,000 properties) wildfire in California history. This single fire has been estimated to cost around $16.5 billion dollars in damages. The average loss ratio for California Homeowners market was above 130% in 2018, and this single event forced insurance companies to increase their premiums. We already see multiple insurance companies attempting to exit (or lower their market share) California Homeowners market and non-renews became a big problem for consumers who are looking for a coverage.
Local governments, insurance companies, and technology vendors should do a better job understanding wildfires and we believe there is a demand for better data and models in the market. This is why we started hearing a lot of questions about wildfire modeling whether it’s possible to utilize AI to build better predicting models for wildfire risk, long before Camp Fire happened. The first thing we did was looking at existing alternatives in the market. One of the common problems we have seen in different models was that they assumed the relationship between wildfire events and the factors that could explain those events were linear. Another common problem we have seen was models relied on only a few variables e.g. soil type, slope, aspect, and access to roads. According to U.S. Department of Interior, humans are the cause of around 90% of wildfires. Clearly slope, aspect, or access to roads cannot be causes of wildfires, they are merely factors that affects the severity of fires.
Our model used over 25 variables that can start or accelerate wildfires, however these three are perhaps the most interesting ones: (1) Glass bottles that shatter over time and carried away by winds work as magnifiers to starts fires, therefore, we had to input this information to our model. Drivers stop by the road side tend to leave their trash there, this is why we used distance to intercity roads as a factor to the model. (2) Forgotten campfires in campgrounds are another important factor that we had to include to our model. (3) Poorly maintained power infrastructure started the Camp Fire. Distance to high voltage power lines are also another important factor that we have included in our model.
UrbanStat’s Wildfire Model has produced superior results compared to U.S. Forestry’s map. When you overlay the last 20 years of wildfires in California on U.S. Forestry’s map only 54.8% of the areas that burned is classified as `High` or `Very High` risk. The same analysis with UrbanStat’s map produces better results and this performance metric increases to 80.5%.
We strongly believe in our model’s ability to successfully predict the areas that have the highest wildfire risks. This is why we publish this analysis publicly. According to UrbanStat’s AI based wildfire risk map, here are the cities most at risk due to wildfires in California:
- Ramona CCD, San Diego, CA
- Moorpark CCD, Ventura, CA
- Alpine CCD, San Diego, CA
- Jamul CCD, San Diego, CA
- Laguna-Pine Valley CCD, San Diego, CA
- Fillmore CCD, Ventura, CA
- Ojai-Mira Monte CCD, Ventura, CA
- Simi Valley CDD, Ventura, CA
- Santa Paula CCD, Ventura, CA
- Palomar-Julian CCD, San Diego, CA
According to our model, 68.5% of the areas that have similar characteristics to cities mentioned above has already experienced a wildfire. According to U.S. Forestry and UrbanStat risk maps 35% of California is considered to have `High` or `Very High` risk. These cities only represent 2.5%.
Are you interested in hearing more about UrbanStat’s Wildfire Map? Contact me at [email protected]