Augment
Underwriters need to spend time looking up risk information from various sources and spend up to 30% of their time on data collection. Our Risk Analysis APIs augments your data with over 30 data sets for every address in the US, Canada, Europe, and the UK.
Prioritize
As opposed to “first in first out” approach, you can prioritize the submissions based on our AI based risk score and AI based “more likely to bind” score. This helps underwriters and portfolio managers to prioritize the underwriting work to maximize financial returns.
Select
More than half of submissions you receive are beyond your appetite. Our risk scoring algorithm identifies these submissions making sure that underwriters don’t waste time on unnecessary work. By filtering out these high-risk submissions automatically, you improve your loss ratio by up to 7-points.
Point Risk
Type in an address, Policy No, or coordinates, UrbanStat Risk Analysis API will analyze the property location with over 30 different data points such as Tornado, Hail, Flood, Tropical Storms, Building Age etc. including our proprietary Wildfire Risk Map for California.
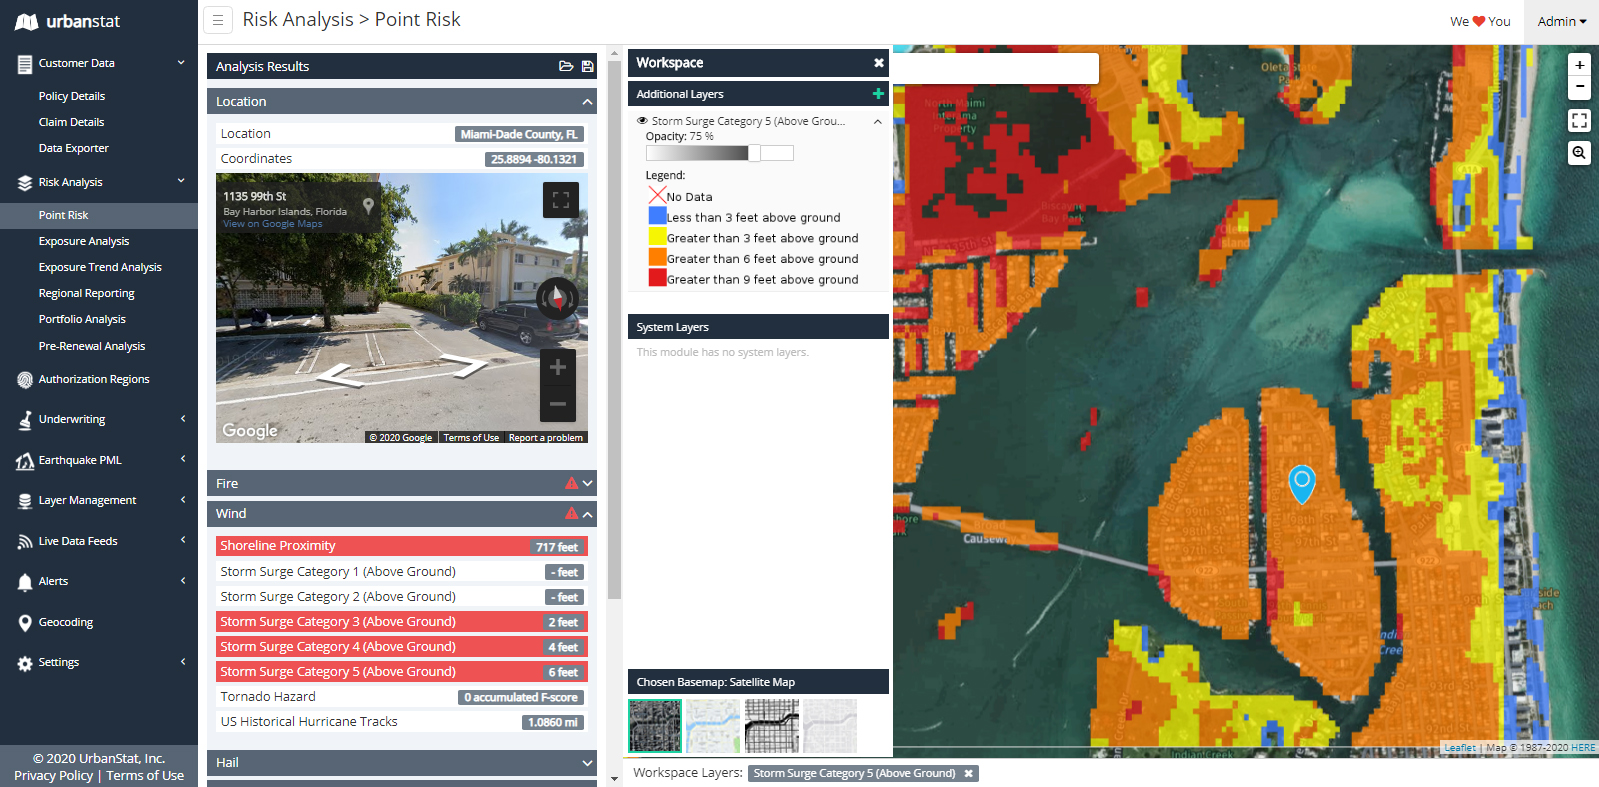
This location has Fire, Wind, and Flood risk. You may want to look closer.
Aggregation analysis, “most common claims in the area” analysis, underwriting guidelines, and historic event analysis.. All in this little box.
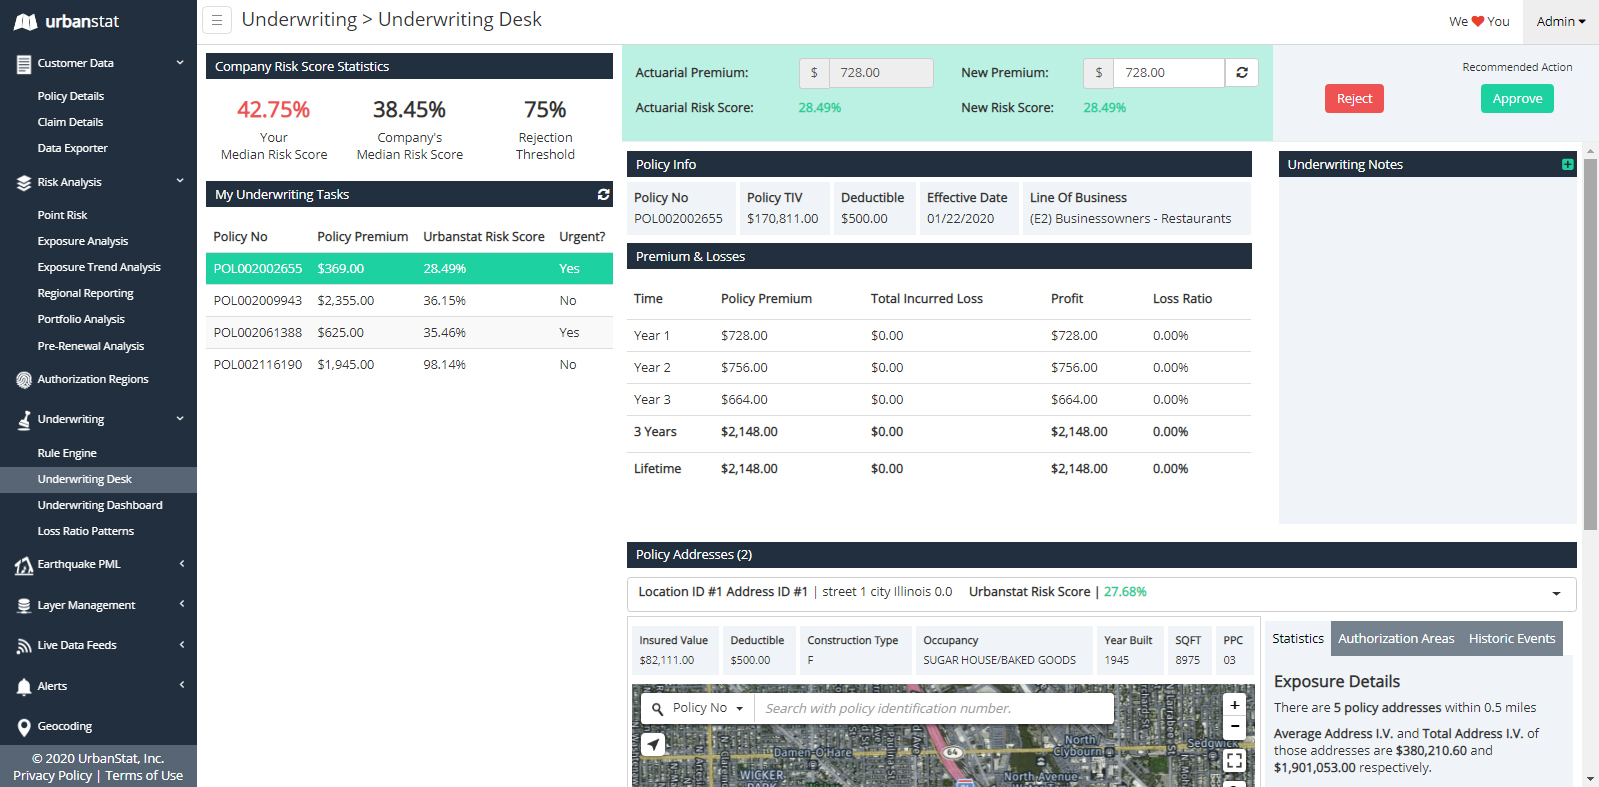
Our proprietary risk scoring algorithm determines if we need to filter out this customer or we can go ahead and accept it. This algorithm improves your loss ratio by up to 7-points.
Our platform calculates the P&L for this customer each year for last 3 years and for its lifetime value.
Underwriting Notes box allows you to review previous notes and to write your own so next time we look at this policy, we know why we made the decisions we made today.
Underwriting Desk
Underwriting Desk enables you to access all relevant information about the property in just one dashboard. Our APIs will pull in customer information from your core systems and we will augment the information with other data and analytics including, our proprietary UrbanStat Risk Score, P&L calculations, location based risk analytics, aggregation calculations, historic event analysis, “most common claims in the area” analysis, and finally moratoriums and underwriting guidelines. All in one screen, easy to access and easy to view.
Underwriting Guidelines/Moratoriums
Insurance companies have hundreds of underwriting guidelines and moratoriums. Sometimes they are hard to set up, harder to review, and impossible to manage. With our “Authorization Regions” module, creating, reviewing and managing Underwriting Guidelines and Moratoriums have never been easier. You simply draw a polygon, set up your parameters and click “Save”. UrbanStat Risk Analysis API takes care rest of it. This way you don’t have to set up moratoriums for entire States or Counties.
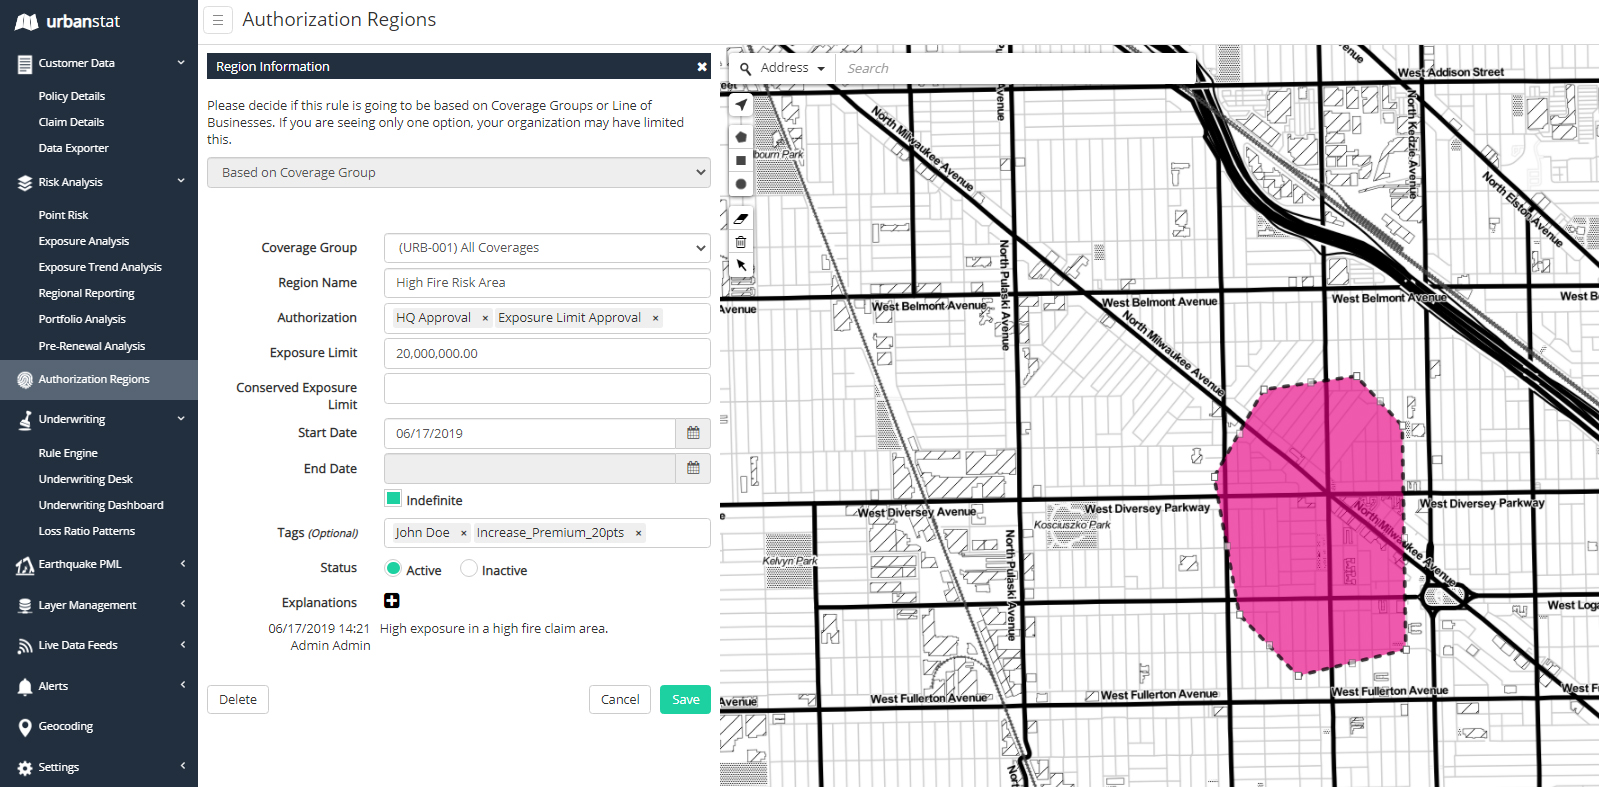
There is a few block radius area in downtown Chicago where you had major fire claims in just a few years. You want to review all applications and limit your exposure in this area. Draw a polygon, set up your parameters, and we will handle the rest.
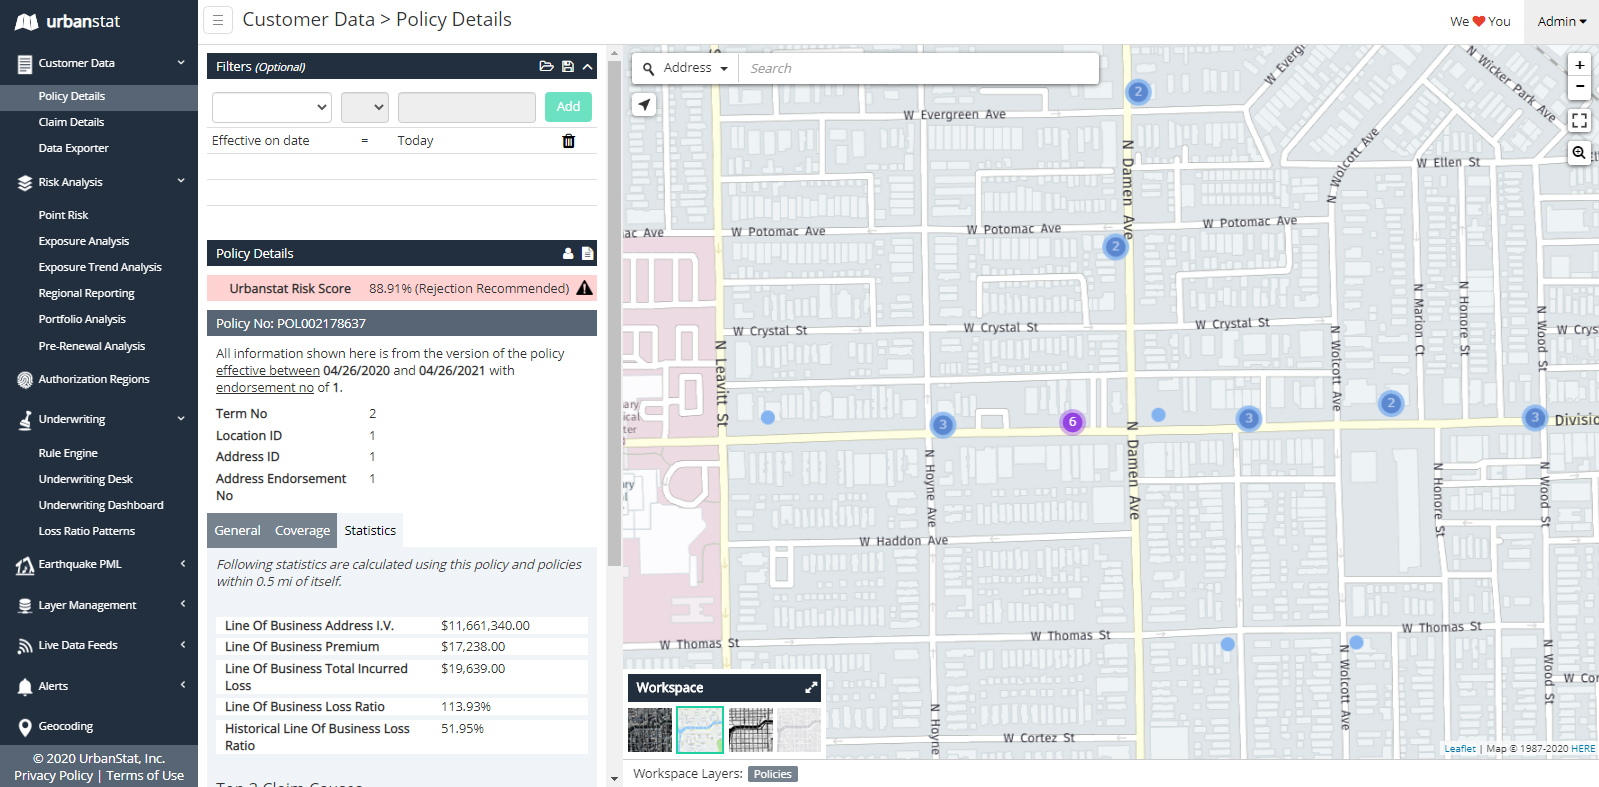
A year has passed since you have looked at this file, a lot has changed in the world and in your portfolio since then. Our algorithm determines that this is not a great fit for your portfolio anymore.
Historically you had ~50% loss ratio in this area, now it is over ~110%.
Looks like you now have 6 policyholders in the same building and more in the proximity.
Renewals
You accept a client to your portfolio and that client is a great fit for you at that moment. What about next year? The year after? Our Policy Details module allows you to review your policy along with rest of your portfolio in that specific area and helps you understand if this policy holder is still a good fit for your portfolio.
Use our APIs or User Interfaces
Risk Analysis API
1 API call, over 100 analysis results, less than 5 seconds. You can use our APIs to create your own experiences within your own core systems. The good news is we are already integrated with Duck Creek and OneShield, integrating to other core systems takes only a few weeks.
User Interfaces
Are you looking for a new underwriting system? You can use our user interfaces and start underwriting better today. Our user interfaces function in modern web browsers on PC, Tablets and Smart Phones.