Exposure Alerts
This is our full automation mode. Set up your exposure alerts once and let our technology do the rest and notify you if there are areas that starts accumulating more exposure than you can financially carry.
Regional Reporting
If you are curious about your portfolio distribution based on administrative boundaries such as states, counties, cities, postal codes, census tracts etc, use our Regional Reporting module to analyze your entire portfolio in just a few seconds.
Portfolio Risk Analysis
Are you curious about what percentage of your portfolio is within a few hundred feet away from the nearest cost? Do you know how much exposure you have in wildfire prone areas? Our Portfolio Analysis module will help you understand your portfolio risk in just a minute.
We’ve got more.
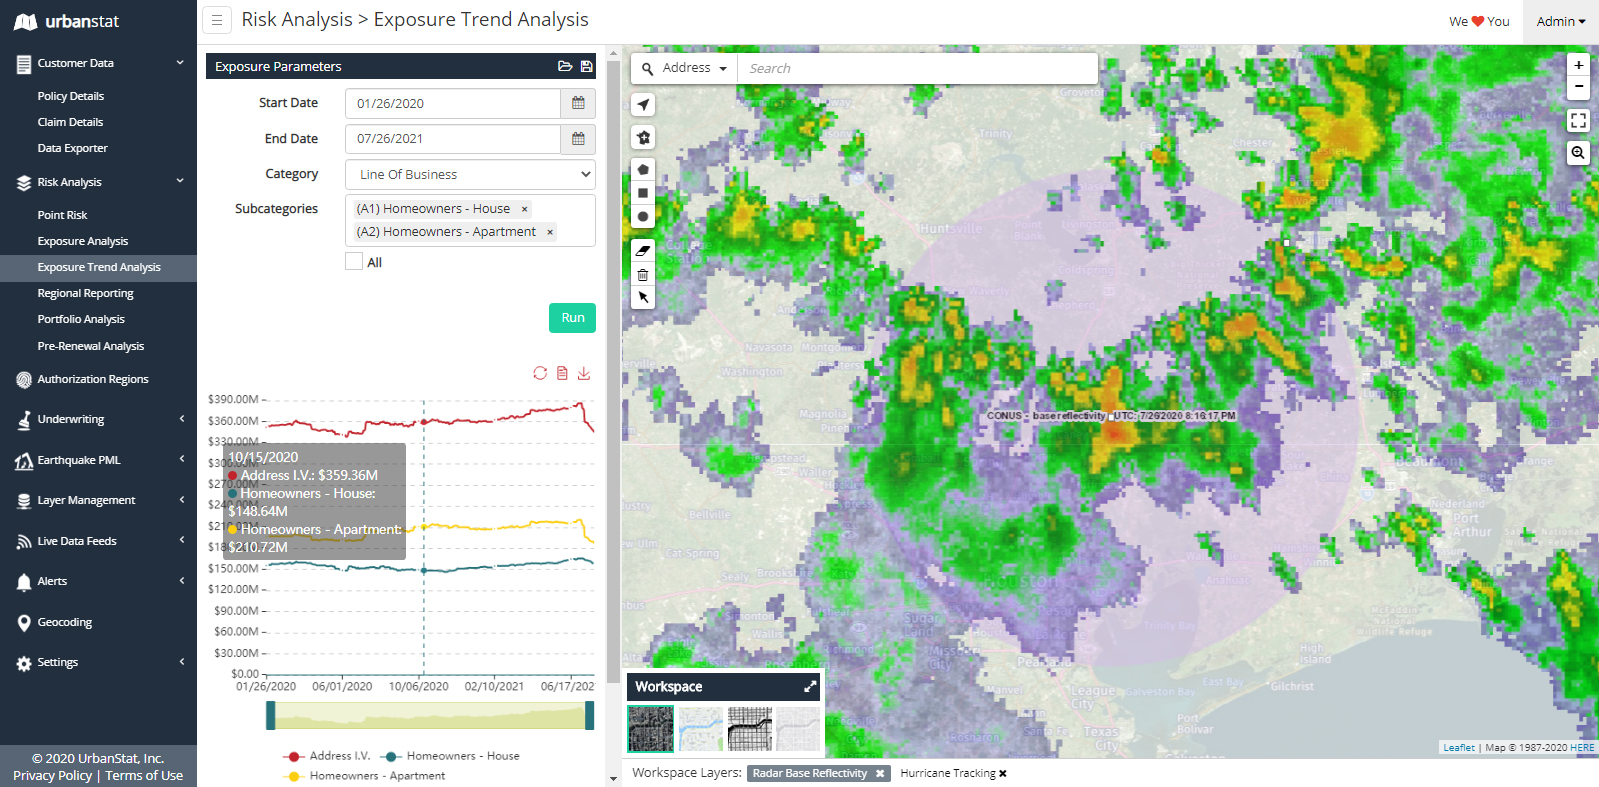
An hurricane is about to hit your portfolio, with UrbanStat it only takes a few minutes to identify the policyholders that will be impacted.
Be it Hurricanes or Wildfires, we got you covered.
Our real-time integration to federal and local organizations will enable you to identify the policy holders that will be impacted by these events within just a few minutes. You can use this information to notify your customers so that they can take preventative measures and get an understanding of what you need to do manage your reserves.
Visualize your exposure with Layer Builder
If you are not a big believer of administrative boundaries like postal codes or census tracts, Layer Builder will help you identify hot-spots in your portfolio automatically. You can then visualize your exposure on a map and start running analysis on it.
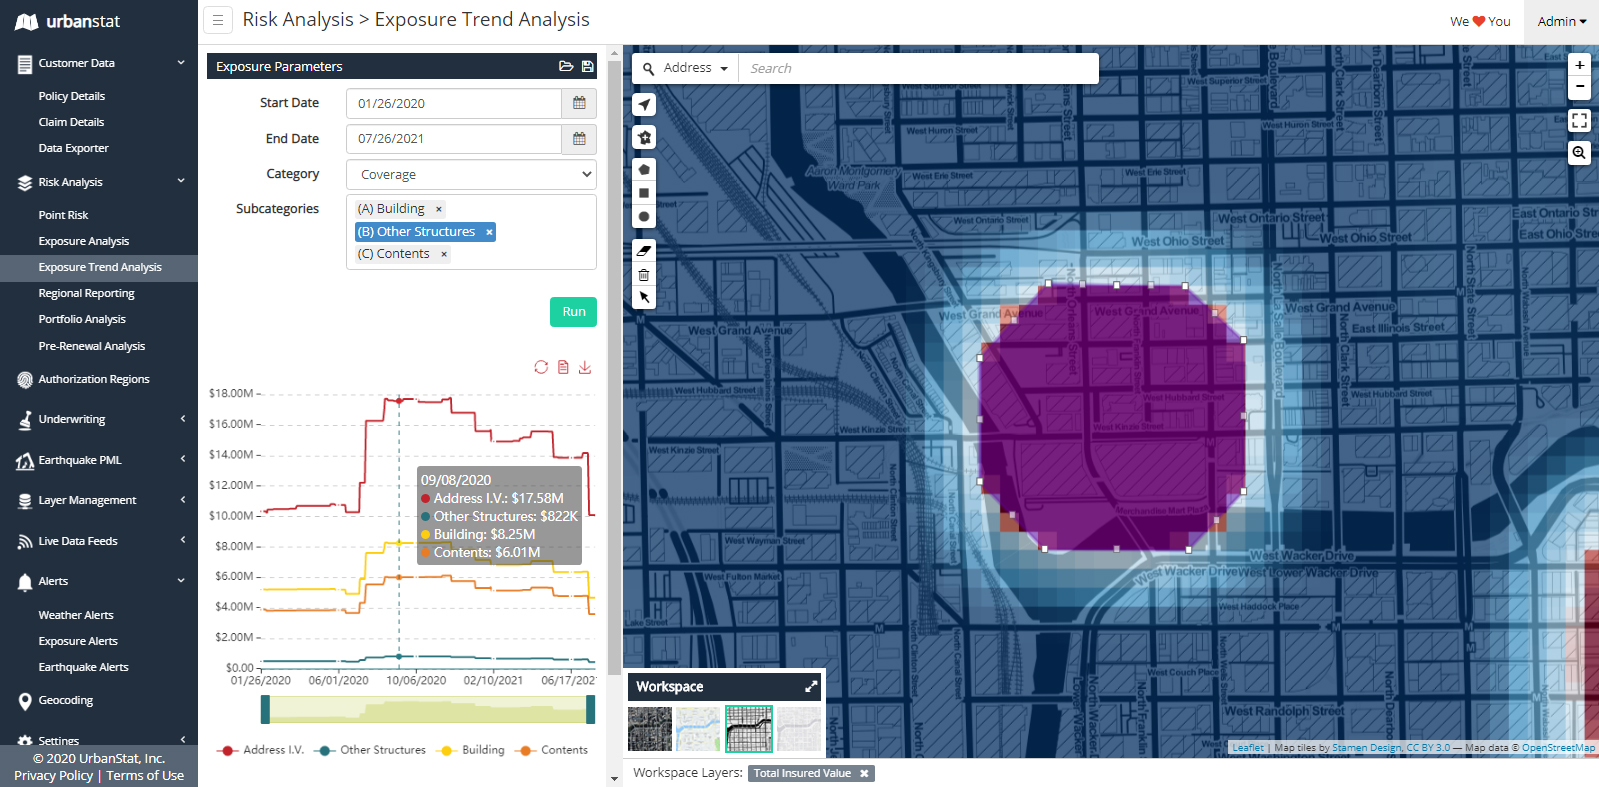
Go beyond the ZIP Code, see your exposure street by street and identify areas that might hurt your portfolio.